On 28 April DCMS, published 2 reports looking at the use of libraries by adults in England: Taking Part, focus on: libraries and Taking Part: Longitudinal Report 2016.
Together these reports, which are based on data from the Taking Part survey, tell us more about:
- who uses libraries and for what purpose
- the reasons that individuals start using libraries (or start going more or less frequently)
- user’s views of the service they receive
Headline figures
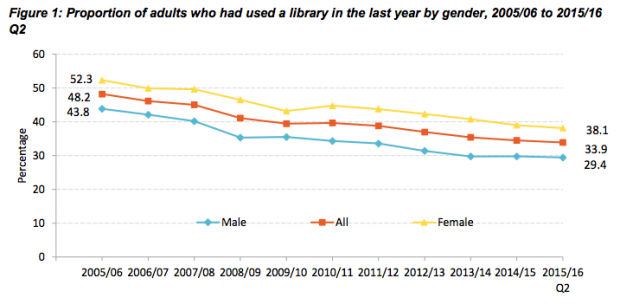
In the year to September 2015, 34% of adults had used a public library service in the 12 months before being interviewed. This is a statistically significant decrease since data collection began in 2005/06, but is a similar proportion to 2013/14 and 2014/15.

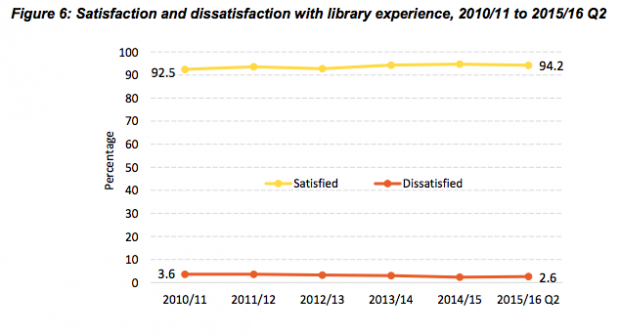
Although the proportion of adults in England who use public libraries has been declining, satisfaction with library services among users is very high. 94% of adults who used the library were very satisfied or fairly satisfied with their experience. This number has been consistently high (more than 90%) since this information was first collected in 2010/11.

The vast majority (95%) of library users still physically visit a library building to make use of library services, while 18% use computers to remotely view library websites, catalogues or databases, or to loan e-books.
In the latest year, only 1% of library users had received an outreach service (such as a home library service) or attended library events.
Who uses libraries?
Library users are more likely to be:
- women than men
- from upper socio-economic groups than lower socio-economic groups (though this gap is narrowing)
- non-working adults than working adults
- from black and minority ethnic groups than white ethnic groups
Having children can also influence library use. Adults who live with children are significantly more likely to have used public library services than those who do not. In addition, adults who went to the library themselves when they were growing up were also more likely to go to the library as adults.
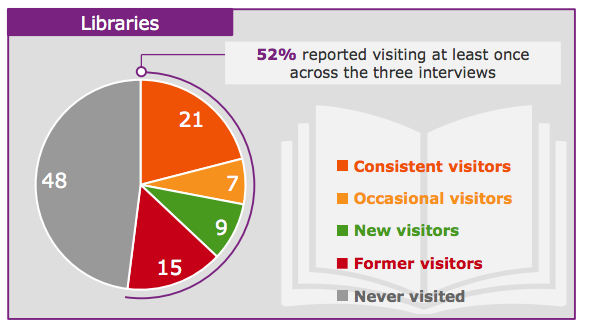
Data from adults who have been re-interviewed annually (for 3 years) show that the libraries sector has a core of “Consistent users” (21%) who reported using libraries at all 3 interviews. Just over half of respondents (52%) reported using public library services at least once over 3 interviews. Overall, there were fewer library users by the third interview than at the first interview: 9% of respondents were classified as “New visitors”, but 15% were classified as “Former visitors”.

New visitors made more frequent use of library services than Former visitors. A third of New visitors reported using library services every month, compared to one in five Former visitors. New library users were more likely to be in the lower socio-economic group than Former visitors (42%, compared to 32%).
Why are people changing their library use?
Amongst adults whose frequency of library use has increased over a period of 3 interviews, encouraging a child to read books was the most common reason given for this increase (20% of respondents), while “I like to read/wish to read more” was the second most common reason (18% of respondents).
Among those whose use of libraries decreased over a period of 3 years, the most common reason for this decrease was having less free time. The next 2 most common reasons for using services less often were getting books elsewhere (17%) and reading e-books instead (12%).
More about Taking Part
These figures come from Taking Part, focus on: libraries and Taking Part: Longitudinal Report 2016.

Taking Part is a household survey run by DCMS in partnership with Arts Council England, Historic England and Sport England. Each year approximately 10,000 adults and 1,000 children in England are interviewed in their homes and asked about what they do in their leisure time, including whether they participate in the arts, visit heritage sites, libraries or museums or galleries, or do any sport. Approximately half of the people interviewed each year are answering the survey for the first time, while the other half are ''longitudinal respondents", which means they are re-interviewed annually.
DCMS uses the Taking Part survey to track engagement with DCMS sectors. Headline figures of engagement with DCMS sectors (including libraries) are published twice a year for adults (in December and July) and once a year for children (in July). As some people are interviewed over multiple years, Taking Part can also tell us about drivers of changes in participation over time.
If you'd like more information about the Taking Part survey, please visit the Taking Part web pages, or email the Taking Part team. You may also be interested in the Taking Part strategy. Published in March this year, it outlines proposed developments to the survey, including changes to the questionnaire that will enable us to collect better data about libraries in the future.
[Editors note: The Libraries Taskforce Team have recently been working with the team who run the DCMS Taking Part Survey to make some changes to the standard question set used in the Taking Part surveys. The intention is to make the outputs more helpful to library services and reflects feedback the Taskforce have received on which data sets library services would find most helpful. These changes came into effect for surveys carried out from the beginning of April 2016.
Historic data, including the 2014/15 adult and child Taking Part record level data, are available on the UK Data Service].
3 comments
Comment by Tim Coates posted on
If use is going down it is completely irrelevant to say that user satisfaction is high -
Is there no one on this team with any consumer data experience ?
Changing the question asked in research will not help to understand the real problems
This is low standard work - it is tardy and incompetent . Library users ( and councillors for that matter ) deserve better
Comment by Tim Coates posted on
The reasons for declining use of any service are to be found by asking lapsed users
By definition "lapsed users " do not "take part" - that is what the expression means
Therefore in order to find their reasons for dissatisfaction the researcher has to find them elsewhere
The satisfaction levels of users do not contribute to the understanding of declining use
With the greatest respect - if we are to save the public library service we have to separate the exercise of understanding what is wrong with it from the exercise of telling people how wonderful it is
Comment by Helen Miller-Bakewell posted on
Thank you for your comments on the blog. I appreciate your concerns around changing the questions we’re asking in the Taking Part survey, but I hope it will reassure you to learn that retaining a consistent trend for the headline figures has been a priority. The headline measure of engagement with public libraries (the proportion of adults in England who have used a public library in the 12 months prior to interview) will remain unchanged. We publish this information, including a demographic breakdown of users, every six months. Each biannual report comes out four months after the proceeding field work period finishes (so data collected in the year April 2015 – March 2016 will be available this July).
The Focus On and Longitudinal reports this blog is highlighting are published less frequently than the biannual reports and allow us to try and understand what’s going on underneath the headline figures. That’s why we think reporting things like user satisfaction can be useful: findings like this reiterate that this is a complex policy area.
Changes to the Taking Part questions focus on improving our understanding of how people are using libraries and, crucially, understanding more about why people do not engage with libraries. The new questions reflect some of the areas highlighted when the Taskforce held a workshop on data at the end of last year.
Taking Part is a nationally representative survey: approximately 10,000 adults are interviewed each year, which includes regular library users, lapsed library users, and people who say they do not use libraries. This gives us an opportunity to ask questions of those who do not use the library – you will see that we reported on those who are lapsed users in the longitudinal report (the main reasons for a decrease in library use were less free time, getting books elsewhere and reading e-books instead).
Finally, I’d just like to reassure you that the Taking Part reports were produced by the statisticians in DCMS and are National Statistics. There are strict rules governing the production of National Statistics, which protect their integrity and ensure they are free from policy or ministerial influences.