[Editor’s note: Joan O’Bryan, an MPhil candidate in Public Policy at the University of Cambridge, undertook a 4 week placement with the Taskforce Team during April and May 2018. She interrogated CIPFA statistics sheets from 2006-07 to 2016-17 to analyse trends regarding public libraries in England, as well as assess the reliability and limitations of the CIPFA dataset.]
The highlight of my master’s program was my work placement at DCMS. I spent four weeks with the Libraries Taskforce, learning about local library service provision and data analysis.
My coursework at Cambridge has largely centred on “evidence-based policy,” which is a form of government practice that emphasises the need for rigorous data analysis before making policy decisions. The coolest part of my work with the Libraries Taskforce was getting to see a real-life situation in which evidence (the data), the public discourse, and government policy interact.
I worked with one of the most referenced sources of data on British public libraries: the CIPFA Public Libraries statistics sheets. The data in these sheets is collected by the Chartered Institute of Public Finance and Accounting (CIPFA) and is used by many library stakeholders to understand and make decisions about public libraries in England.
However, the data has not been structured for easy access, so a lot of the analysis relied on in public discussions has been relatively superficial. For instance, the CIPFA data shows that libraries are declining in use, such as visits and book issues, but there hasn’t been any analysis on why those trends are occurring or how some library services are fighting against them.
Common explanations for decline
For my project, I used the CIPFA statistics sheets from the past decade to create an excel database, from which I could analyse in more depth some of the most common hypotheses posited for the decline in library use in England. My report looked in depth at seven arguments:
- The ‘cuts’ argument: declining investment makes for lower quality product, resulting in declining repeat use.
- The ‘failure to modernise’ argument: library leaders have failed to innovate in response to changes in service demand, which prevents the acquisition of new users and hinders repeat use.
- The ‘time-poor’ argument: usage has declined because libraries face increased competition with a wider range of leisure-time options and work commitments
- The ‘digital shift’ argument: changes in consumer behaviour, and particularly channel shift away from print and towards digital, have left the ‘physical library’ obsolete.
- The ‘changing use’ argument: the way people use libraries is changing, but current metrics are failing to pick up these patterns of altered use.
- The ‘failure to market’ argument: library leaders have neglected targeted marketing to engage traditional non-users and new customers.
- The ‘fragmentation’ argument: devolution by the national government has made it difficult to manage and strategise across English libraries (as one would a national retail chain).
To analyse them, I divided the library services into quintiles and examined the effect of different variables on library service performance.
For instance, when exploring the cuts argument, I compared library expenditure against book issues and visits.
I was trying to answer the question: “Do declining expenditures explain declining library performance?”
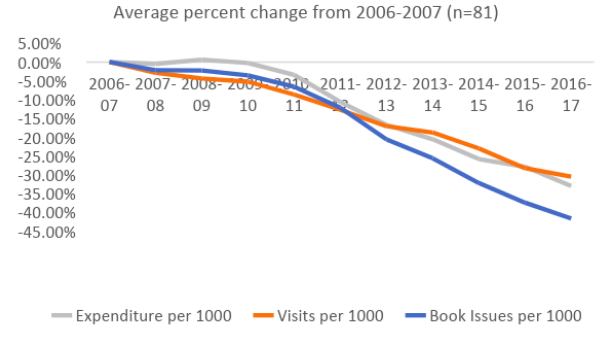
Overall, expenditure seemed highly correlated with performance. Across library services in England, when expenditure decreased, so did visits and issues.
However, the picture becomes more complex when we look at the quintiles.
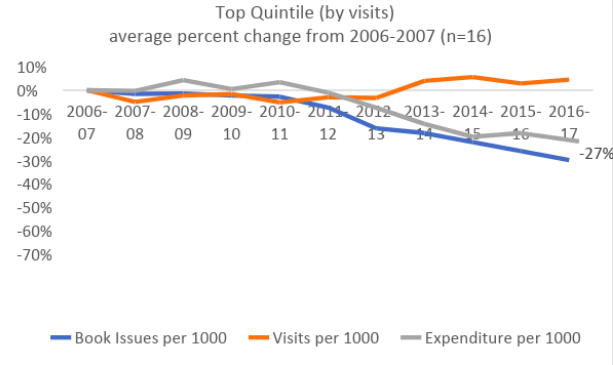
The first thing you’ll notice is that the top quintile in visits completely bucks the trend of overall decline. The second thing you’ll see is that they do so despite decreases to their expenditures.
In the bottom quintile, the trends are far more similar to the national trends. Expenditure declines and declines in visits are highly correlated.

The top quintile in visits had a somewhat better average percent change than in the bottom quintile (-27% versus -36%), a difference of 9 points, but their average percent change in visits (5% versus -56%) was much higher, resulting in an over 60-point difference.
What does this mean for the cuts argument?
Well, it seems to imply that – at least for visits – declining expenditure is not the most important variable in explaining declining library use. Some library services are able to outperform their budget cuts.
However, it doesn’t mean that expenditure isn’t important.
As the graphs show, expenditure declines in the bottom quintile began earlier and decreased faster than expenditure declines in the top quintile. This may imply the presence of an underlying variable, such as council priorities, that determines which library services are generally better supported or more used. It’s also interesting to note that performance for library services in the bottom quintile was gradually declining before expenditure declines began, and that performance declined sharply when expenditures did. It implies that budget cuts in some library services can exacerbate existing trends, making it harder for those services to become successful.
Correlation is not causation
Of course, correlation is not causation, and my data analysis could only show correlation. However, now this initial work has been done, it could be an exciting project for another intern to do some statistical analysis of probabilities and causation. The CIPFA data is a rich and tantalising source of information on public libraries.
To learn more about my research project, you can read the full report, which is available on GOV.UK.
-----------------------------------------------------------------------------
Please note, this is a guest blog. Views expressed here do not necessarily represent the views of DCMS or the Libraries Taskforce
3 comments
Comment by Christine Fishwick posted on
I am a friend of Darlington Libraries and we are presently fighting to keep our library in its Edward Pease grade II listed building, corner stone laid in 1884. It has so much potential as had Hastings, and could be such an asset to Darlington's culture, but it is jolly hard work getting our Council to alter its decision.
Comment by librariesmatter posted on
A good piece of work.
Section 7 of Joan O’Bryan’s report identifies a number of issues with the CIPFA data.
Perhaps Ian Watson (Chair of the CIPFA Public Library Statistics Working Party) could contribute a blog post on what is being done to address the issues identified.
Comment by Opendata_analysis posted on
Is there any way the general public can get access to the original data used in this analysis to see if there are any other insights that might be found, other than buying it for hundreds of pounds?